Plot Coordinate Versus Radial Position
Sometimes it’s useful to visualize the center-of-mass trajectory for single residues alongside their radial position with respect to the pore centers. A plot of a z-coordinate trace might look like the following:
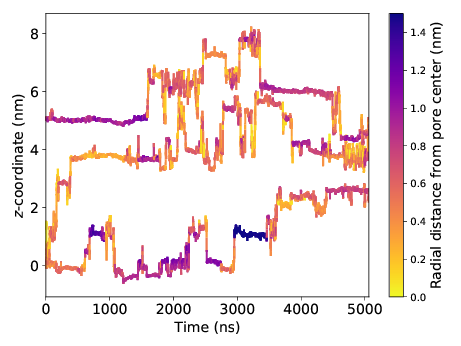
This plot is very information-rich. It tells us that solutes like to make intermittent jumps between periods of entrapment. It also suggests that solute are prone to trapping when far from the pore center (i.e. in the tails).
coordinate_trace.py is probably best used from the command line, however its classes are
documented below to provide the user more control.
Command Line Interface
Calculate mean squared displacement (MSD) and diffusion coefficientfor a specific residue or set of atoms in a trajectory
usage: coordinate_trace.py [-h] [-t TRAJECTORY] [-g GRO] [-r RESIDUE]
                           [-begin BEGIN] [-end END] [-skip SKIP]
                           [-b BUILD_MONOMER] [-atoms ATOMS [ATOMS ...]]
                           [-a AXIS] [-n INDEX [INDEX ...]] [-pr PORE_RADIUS]
                           [-cmax COLORBAR_MAX] [-load LOAD] [-s SAVENAME]
Named Arguments
| -t, --trajectory | |
Path to input file Default: “wiggle.trr” | |
| -g, --gro | Name of .gro coordinate file Default: “wiggle.gro” |
| -r, --residue | Name of residue whose diffusivity we want |
| -begin | First frame to read Default: 0 |
| -end | Last frame to read Default: -1 |
| -skip | Skip every n frames Default: 1 |
| -b, --build_monomer | |
Name of monomer used to build unit cell. Default: “NAcarb11V” | |
| -atoms | Name of atoms whose collective diffusivity is desired |
| -a, --axis | Which axis to compute msd along Default: “z” |
| -n, --index | Solute number whose ztrace you want. If thisis not specified, all of them will be shown Default: False |
| -pr, --pore_radius | |
Max distance from pore center a water molecule can exist in order to be counted as inside the pore Default: 1.48 | |
| -cmax, --colorbar_max | |
Maximum radial distance that getsregistered on the colorbar Default: 1.5 | |
| -load, --load | Name of pickle file to load Default: False |
| -s, --savename | Name to save ZTrace object under. Default: “trace.pl” |
Classes
-
class
coordinate_trace.CoordinateTrace(traj, gro, residue, build_monomer, axis, begin=0, end=-1, skip=1)¶ -
__init__(traj, gro, residue, build_monomer, axis, begin=0, end=-1, skip=1)¶ Initialize the calculation of a center of mass coordinate trace along a specified axis.
Parameters: - traj (str) – name of GROMACS trajectory (.xtc or .gro)
- gro (str) – name of GROMACS coordinate file (.gro)
- residue (str) – name of residue to track
- build_monomer (str) – name of monomer used to build LLC membrane
- axis (str) – axis along which to trace (x, y or z)
- begin (int) – first frame to track
- end (int) – last frame to track
- skip (int) – only record data every skip frames
-
locate_pore_centers(npts_spline=10, save=True, savename='spline.pl')¶ Fit a spline through the centers of the pores based on the pore defining atoms (see Summary of Annotations) of the monomer used to construct the unit cell.
Parameters: - npts_spline (int) – number of points in each pore of the spline
- save (bool) – save the spline
- savename (str) – name of spline
-
plot_trace(nr, colormap='plasma_r', cmax=None, savename=None, show=True)¶ Plot the coordinate trace of chosen residue centers of mass colored according to its radial distance from the closest pore center
Parameters: - nr (int or list of int) – index or indices of solutes to display. Indices are relative to the total number of residues, starting from 0. For example, to look at the first and third residues pass [0, 2]
- colormap (str) – name of colormap to use
- cmax (float) – max value of color scale
- savename (str) – name of plot
- show (bool) – show plot when finished plotting
-
radial_distances()¶ Calculate each residue of interest’s distance from the pore center at each frame
-