Radial Distribution Functions
For hexagonal phase LLC systems, we define the radial distribution function of a component as the number density of that component as a function of the radial distance from the pore center.
The radial distance is calculated as the euclidean distance from the component coordinates to the pore center on the xy plane.
We normalize the counts of each component in each bin based on the bin volume. In our case the bin volume is defined as:
where \(z\) is the membrane thickness, and \(r_1\) and \(r_2\) are the edges of adjacent bins where \(r_2 > r_1\).
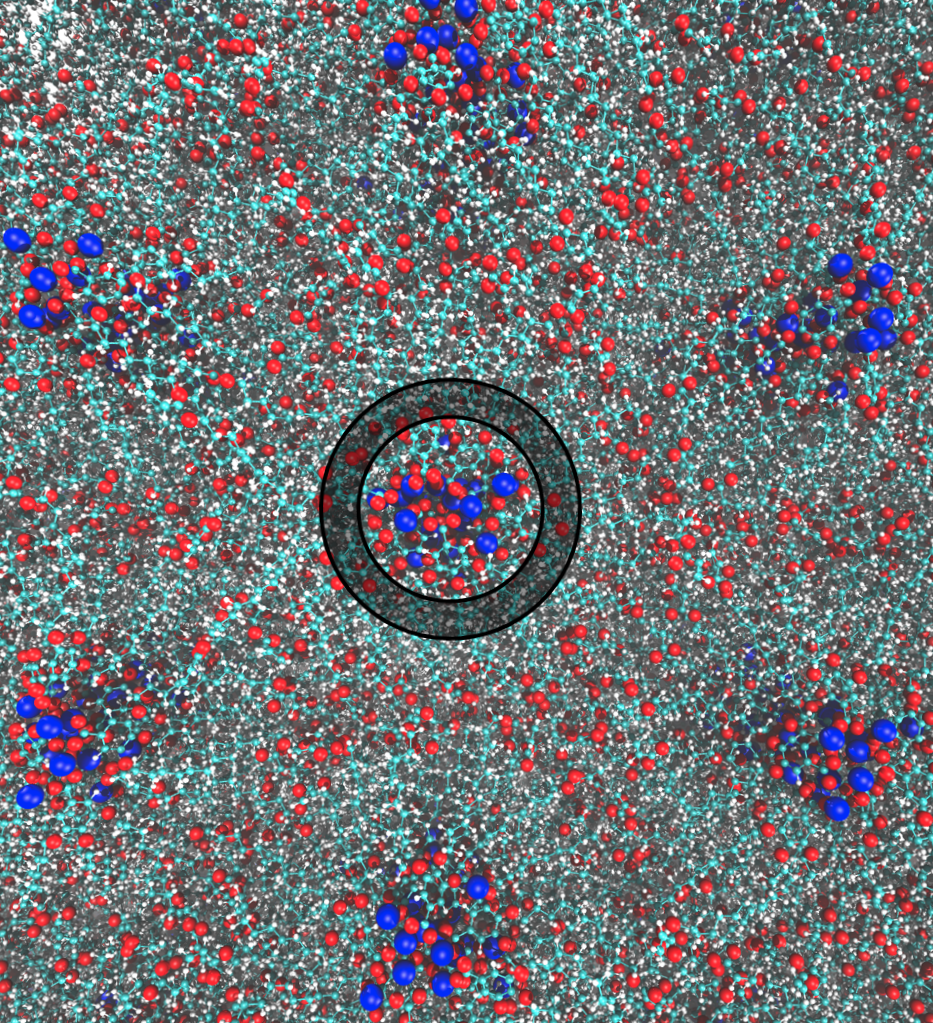
Looking down onto the \(xy\) plane of an atomistically rendered HII LLC membrane, a single bin used while calculating the radial distribution function is represented by the area shaded between the two concentric black circles. In this case, the pore center is defined based on the average location of the blue spheres.
Classes
-
class
rdf.System(gro, traj, residue, monomer, begin=0, end=-1, skip=1, npores=4, atoms=None, com=True)¶ Calculate the radial distribution of a residue, atom or group of atoms in a hexagonal phase LLC Membrane
-
__init__(gro, traj, residue, monomer, begin=0, end=-1, skip=1, npores=4, atoms=None, com=True)¶ Restrict the system to desired components. Calculate centers of mass of components if desired
Parameters: - gro (str) – GROMACS coordinate file (.gro or .pdb)
- traj (str) – GROMACS trajectory file (.trr or .xtc)
- residue (str) – Name of residue to which the desired component belongs. If no other options are specified the radial distribution of this residue’s center of mass will be calculated
- monomer (str) – Name of monomer used to build LLC Membrane
- begin (int) – Index of first frame of trajectory to be used in analysis
- end (int) – Index of last frame of trajectory to be used in analysis
- skip (int) – Do not include every ‘skip’ frames in the analysis
- npores (int) – Number of pores in the unit cell (Currently only works for 4 pores)
- atoms (list) – Restrict residue to atoms named here
- com – Calculate density based on center of mass of residue or group of atoms
-
bootstrap(nboot, nbins=50, cut=1.5, confidence=68)¶ Generate statistics using the bootstrapping technique
Parameters: - nboot (int) – number of bootstrap trials (i.e. number of time data is resampled)
- nbins (int) – number of bins to use when histogramming density each bootstrap trial
- cut (float) – maximum distance from pore center that will be plotted
- confidence – confidence interval (%)
-
build_com(rep='K')¶ Build system with the center of mass of the residue or group of atoms plotted in order to confirm that this script is working
Parameters: rep (str) – name of atom to use to represent spline Returns: ‘com.gro’
-
build_spline(pore_centers, rep='K')¶ Build the spline into the last frame of the trajectory
Parameters: - pore_centers (np.ndarray) – output of physical.avg_pore_loc() with spline=True
- rep (str) – name of atom to use to represent spline
Returns: ‘spline.gro’
-
plot(show=False, normalize=False, save=True, savename='rdf.pdf', label=None)¶ Plot the radial distribution function
Parameters: - show (bool) – Display plot
- normalize (bool) – Divide by all values of RDF by the maximum value
- save (bool) – Save the plot under savename
- savename (str) – Name and format (determined by file extension) under which to save plot
- label (str) – Legend label. If None, residue name will be used.
-
radial_distribution_function(spline=False, progress=True, npts_spline=10, build=True)¶ Calculate the radial distribution function based on xy distance of solute center of mass from pore center
Parameters: - bins (int) – number of bins in histogram of radial distances
- cut (float) – largest distance to include in radial distance histogram
- spline (bool) – locate pore centers as a function of z. Recommended. Slower, but more accurate
- progress (bool) – Show progress bar while generating spline
- npts_spline (int) – Number of points making up spline through each pore
- build (bool) – Create a .gro file of the last frame with the spline represented as atoms
- nboot – Number of bootstrap trials
-
Functions
-
rdf.grps(name)¶ Return names of atoms making up specialized groups. This is specifically for NaGA3C11.
TODO: incorporate these groups as annotations (maybe)
Parameters: name (str) – specialized group names. Valid options are ‘head groups’ and ‘tails’ Returns: atom names that constitute specialized groups
Examples
# imports
from LLC_Membranes.analysis import rdf
# The most basic usage
sys = rdf.System(gro, traj, residue, monomer)
sys.radial_distribution_function()
sys.bootstrap(200)  # 200 bootstrap trials
sys.plot(show=True)
# Restrict residue to the center of mass of a group of constituent atoms
atoms = ['C', 'C1', 'C2', 'C3', 'C4', 'C5']  # name of carbon atoms in the monomer head group
sys = rdf.System(gro, traj, residue, monomer)
sys.radial_distribution_function()
sys.bootstrap(200)  # 200 bootstrap trials
sys.plot(show=True)
Command Line Functionality
Calculate radial distribution function for components of a hexagonal phase LLC membrane system from the command line
usage: rdf.py [-h] [-g GRO] [-t TRAJ] [-r RESIDUE [RESIDUE ...]]
              [-b BUILD_MONOMER_RESIDUE] [-bins BINS] [--begin BEGIN]
              [--end END] [-skip SKIP] [-l LOAD] [-nboot NBOOT] [-spline]
              [-spts SPLINE_PTS] [-atoms ATOMS [ATOMS ...]] [-normalize]
              [-cut CUT] [--noshow]
Named Arguments
| -g, --gro | Name of coordinate file Default: “wiggle.gro” |
| -t, --traj | Trajectory file (.trr, .xtc should work) Default: “traj_whole.xtc” |
| -r, --residue | Name of residue whose radial distribution function we want to calculate |
| -b, --build_monomer_residue | |
Name of monomer residue used to buildHII phase Default: “NAcarb11V” | |
| -bins, --bins | Number of bins for histogram of distances Default: 50 |
| --begin | Frame to begin calculations Default: 0 |
| --end | Frame to stop doing calculations Default: -1 |
| -skip, --skip | Analyze every skip frames Default: 1 |
| -l, --load | Name of compressed .npz to load |
| -nboot | Number of bootstrap trials Default: 200 |
| -spline, --spline | |
Trace pore centers using a spline Default: False | |
| -spts, --spline_pts | |
Number of points making up the spline ofeach pore Default: 10 | |
| -atoms, --atoms | |
| Names of atom(s) which is/are a part of residue whose radial distribution function we want to calculate. | |
| -normalize | Make the maximum value of the RDFs equal to 1 for easier visual comparison (and a single y-axis) Default: False |
| -cut | Largest distance from pore center to include in calculation Default: 1.5 |
| --noshow | Do not display results Default: False |
Example Usage
# Basic usage
test.sh -t trajectory.trr -g coordinates.gro -r residue -b monomer
# RDF of multiple residues or groups
# The RDF of the center of mass of atoms C, C1, C2, C3, C4, C5 of residue_1 and the center
# of mass of all atoms making up residue_2 will be plotted on top of each other
test.sh -t trajectory.trr -g coordinates.gro -r residue_1 residue_2 -atoms C C1 C2 C3 C4 C5 -b monomer