Correlation Functions
A correlation function is a measure of order in a system. It’s main purpose is to determine the spatial relationship between a single atom or group of atoms to other surrounding atoms or groups of atoms.
To understand the expected output of a correlation function calculation, it is easiest to start with a 1D example.
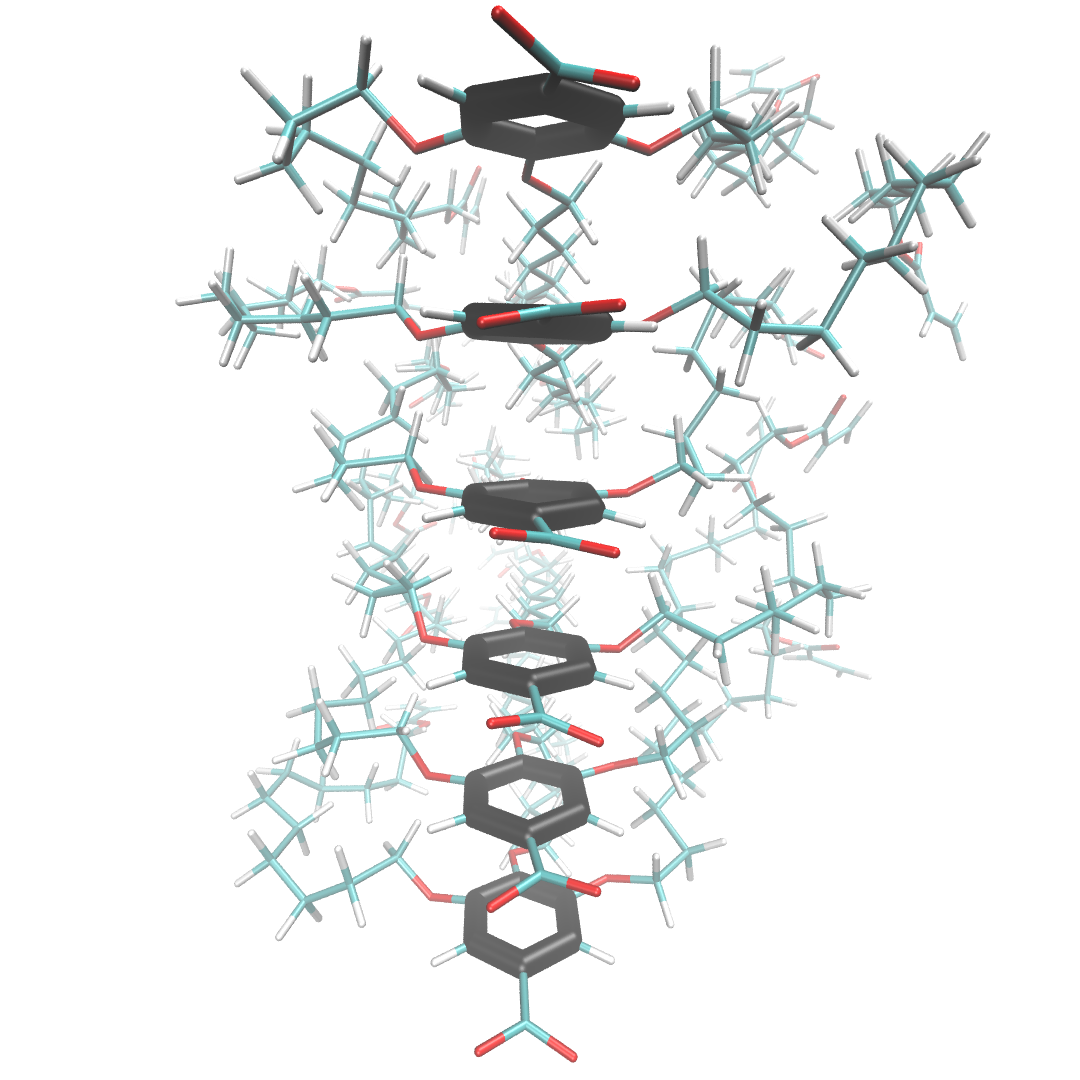
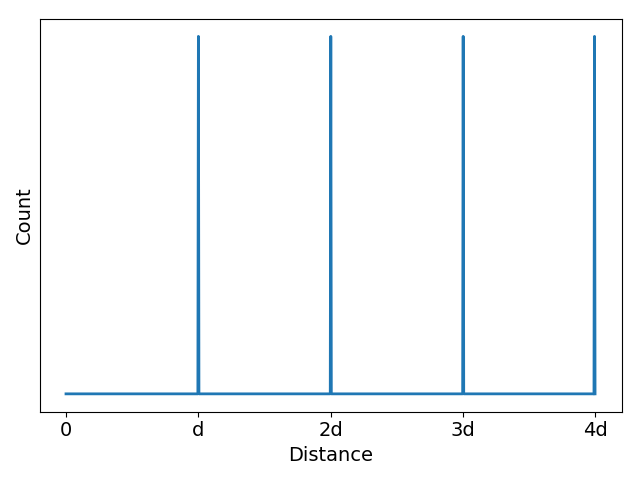
In scenario 1 below, liquid crystal monomers are stacked in a perfect column. The distance, d, between the center of mass of each head group (head group atoms are highlighted black) is exactly the same in all cases. The associated z-direction (the z-axis runs in the same direction that the monomers stack) correlation function shows equally spaced, equally intense, sharp spikes located at d, 2d, 3d …
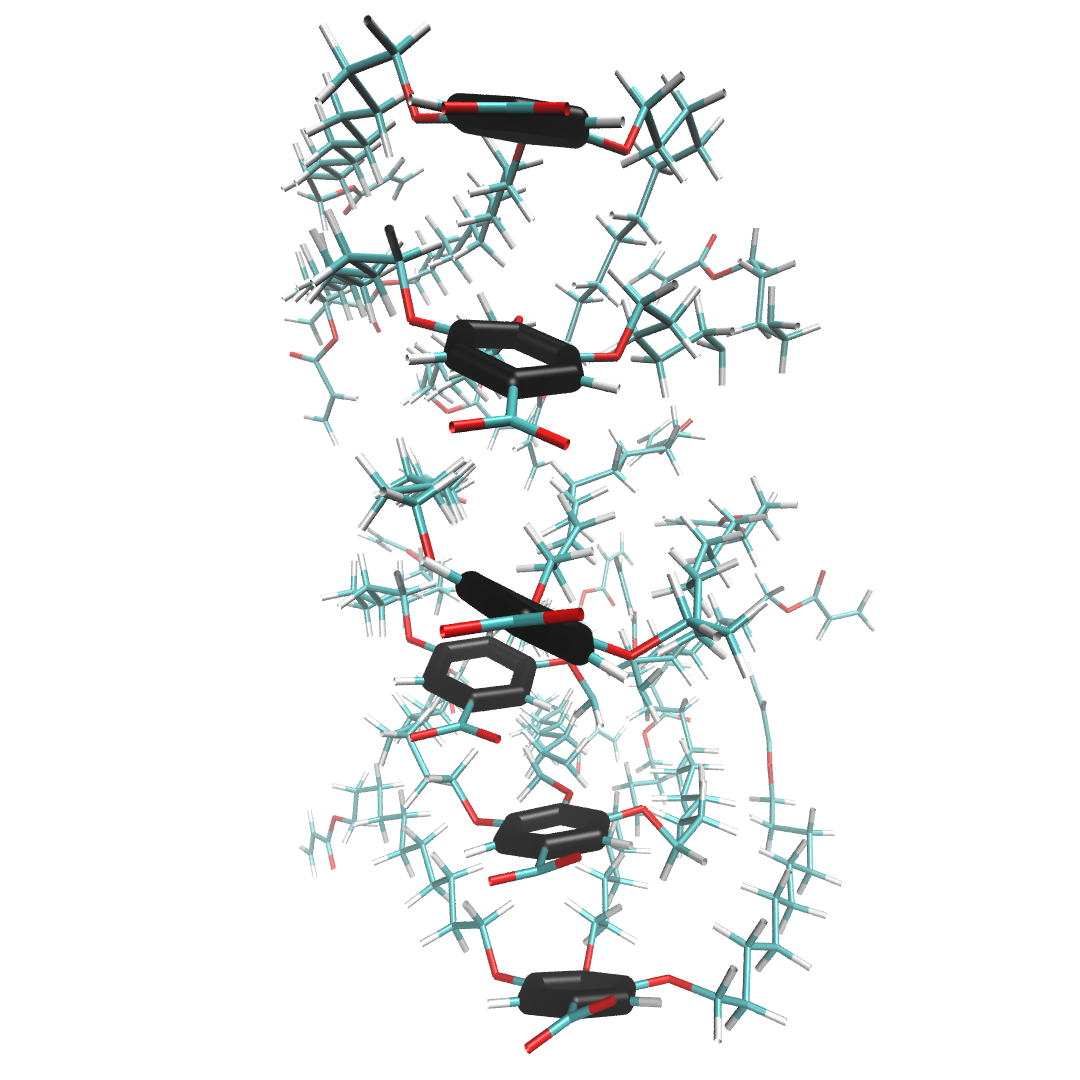
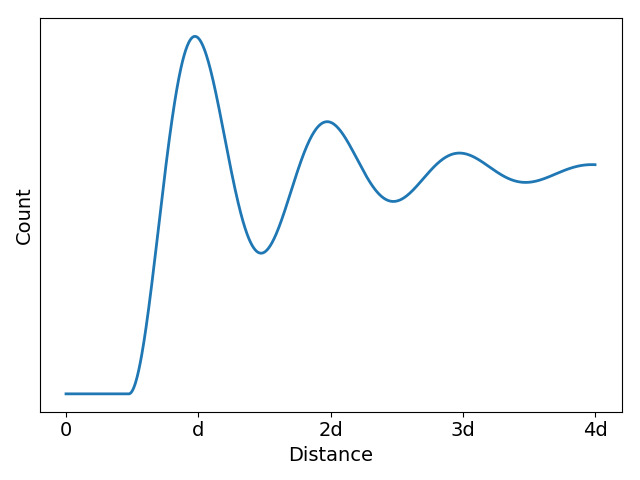
In the more realistic scenario 2, shown below, the liquid crystal monomers are still stacked in a column, but the head groups are far less ordered. The peaks of the correlation function broaden in response to this disorder, but their maxima are still located at about the same place as scenario 1. The amplitudes of the maxima, however, decays exponentially. The exponent describing this decay is related to the correlation length of the system which is a measure of the distance at which two particle positions are no longer correlated.
Classes
-
class
correlation_function.Correlation(gro, trajectory=None, atoms=None, res=None, bins=[100, 100, 100], begin=0, end=-1, theta=120)¶ -
__init__(gro, trajectory=None, atoms=None, res=None, bins=[100, 100, 100], begin=0, end=-1, theta=120)¶ Prepare trajectory for correlation function calculation
Parameters: - gro (str) – GROMACS coordinate file
- trajectory (str) – GROMACS trajectory file (.xtc or .trr)
- atoms (str or list) – Names of atoms to be included in calculation. If there are multiple groups of atoms which you want to keep separate for the COM calculation, each group should be contained within a list within this list. Default is ‘all’ which will include all atoms in the system in the calculation.
- res (str or list) – Names of residue that each atom group is associated with. If there are two groups, there should be two residue names, even if they are the same residue
- com (bool) – Calculate correlation function based on center of mass of groups
- bins (list or int) – number of bins in each dimension for histogramming
- begin (int) – First frame of coordinates to use
- end (int) – last frame of coordinates to use
- theta (float) – angle between xy box vectors
-
make_slice(axis, radius=0, plot=False, show=False, fit=False)¶ Take a slice of the 3d correlation function along a specified axis
Parameters: - axis (int) – axis along which to take slice, where x=0, y=1, z=2
- radius (float) – average all off-center slices within this radius of the center
-
plot_slice(axis, show=True, fit=False, peak_locations=[], limits=None)¶ Plot slice generated by make_slice()
Parameters: - axis (int) – axis along which slice was taken
- show (bool) – show plot at the end
- fit (bool) – fit a decaying exponential function to the peaks
- peak_locations (list) – locations of peaks to be fit
- limits (list or tuple) – x and y limits of plot of form : ([x_lower, x_upper], [y_lower, y_upper]). If you want matplotlib to choose a specific axis limit for you, leave the list for that axis blank. If you want matplotlib to automatically choose both axes, don’t specify anything for this option
-
Examples
# imports
from LLC_Membranes.analysis import correlation_function
# The most basic usage

g = correlation_function.Correlation(gro, trajectory=traj, res=residue_name)
g.calculate_correlation_function()
g.make_slice(axis)
# Correlation function of center of mass of a group of atoms

atoms = ['C', 'C1', 'C2', 'C3', 'C4', 'C5']  # name of carbon atoms in the monomer head group
g = correlation_function.Correlation(gro, trajectory=traj)
g.calculate_correlation_function()
g.make_slice(axis)
Command Line Functionality
Calculate and plot slice of full 3D correlation function. Currently, only slices in the z direction for a monoclinic unit cell are implemented.
usage: correlation_function.py [-h] [-t TRAJ] [-g GRO] [-a ATOMS [ATOMS ...]]
                               [-r RES [RES ...]] [-b BEGIN] [-e END]
                               [-bins BINS [BINS ...]] [-com] [-s SLICE]
                               [--itp ITP] [-m MONOMERS_PER_LAYER]
                               [--layers LAYERS] [--range RANGE [RANGE ...]]
                               [--save SAVE] [--scale SCALE]
                               [-br BLOCK_RADIUS] [--noshow] [--load]
                               [-pr PLOT_RANGE [PLOT_RANGE ...]] [-offset]
                               [-aa] [-invert] [-fit]
Named Arguments
| -t, --traj | Trajectory file. Make sure to preprocess with gmx trjconv -pbc whole Default: “traj_whole.xtc” |
| -g, --gro | Name of coordinate file Default: “wiggle.gro” |
| -a, --atoms | Name of atoms to calculate correlation function with respect to. The center of mass will be used |
| -r, --res | Residue to create correlation function with respect to. Will use center of mass. Will override atoms |
| -b, --begin | Start frame Default: 0 |
| -e, --end | End frame Default: -1 |
| -bins | Integer or array of bin values. If more thanone value is used, order the inputs according to the order given in args.axis Default: 100 |
| -com, --center_of_mass | |
Calculate based on center of mass ofargs.atoms Default: False | |
| -s, --slice | Slice to be visualized |
| --itp | Default: “/home/bcoscia/PycharmProjects/GitHub/HII/top/Monomer_Tops/NAcarb11V.itp” |
| -m, --monomers_per_layer | |
Number of monomers per layer Default: 5 | |
| --layers | Number of layers Default: 20 |
| --range | Range for histogram plot. A list of the form:[dimension 1 lower, dimension 1 upper, dimension 2 lower, dimension 2 upper …] |
| --save | Follow flag with name to save plot by (Not including file extension) |
| --scale | Scale color bar by this factor Default: 1 |
| -br, --block_radius | |
radius of circle around origin to zero out Default: 0.25 | |
| --noshow | If this flag is entered, plots will not be shown Default: False |
| --load | load previously calculated correlation function Default: False |
| -pr, --plot_range | |
| range to plot. A list of the form: [dimension 1 lower, dimension 1 upper, dimension 2 lower, dimension 2 upper …] | |
| -offset | If system is in offset configuration, correlation lengthwill be calculated using every other peak Default: False |
| -aa, --angle_average | |
Angle average the 3D correlation functionabout z-axis Default: False | |
| -invert | Invert correlation function at end to get structurefactor Default: False |
| -fit | Fit decaying exponential function to correlation function Default: False |
Example Usage
# Basic usage
correlation_function.py -t trajectory.trr -g coordinates.gro -r residue
# Correlation function of head group centers of mass
# C C1 C2 C3 C4 and C5 are head group constituent atoms
correlation_function.py -t trajectory.trr -g coordinates.gro -r residue -a C C1 C2 C3 C4 C5